President Obama Approval Rate


This morning I was reading on the fivethirtyeight site an interesting section dedicated to the US elections. It tries to predict who will win the election based on the polls and historical data. They have been very accurate in the past, so it is definitely an interesting source.

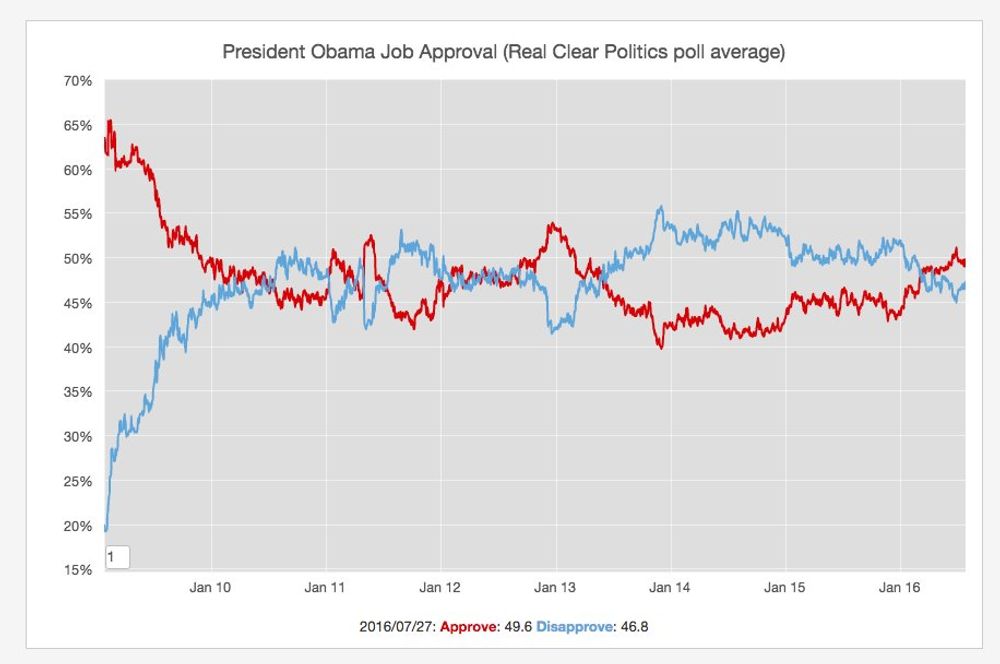
One of the articles linked on this site was a post titled "Why Obama Might Be Trump's Biggest Challenge," which discussed how President Obama is enjoying a high approval rate. The chart above is generated with the >>>Real Politics>"http://www.realclearpolitics.com/epolls/other/president_obama_job_approval-1044.html" data they were mentioning in the post.

Big Mac Index


According to their website "THE Big Mac index was invented by The Economist in 1986 as a lighthearted guide to whether currencies are at their 'correct' level". It's interesting because even if it was designed to compare the purchasing-power parity, it shows the imbalance between different currencies. This map shows the last calculated index in July 2016.

Nice picture in the Lustgarten


Last weekend on a sleepless night I set up the site pics.inberl.in to check the different pictures I have been taking in the city. When I was browsing through my collection, I found this cool photo I took in my first weeks in Berlin at the Lustgarten. I'm proud of the composition.

US Violent Crime Drop


Last week, we discussed how the RNC "fear" topic related to crime in the US was not backed by facts. The previous charts generated with FBI data support this.

React Trending


I was discussing it with a colleague a couple of days ago. The Facebook React is definitely going to stay around. Look at the previous graphs showing the increase in Wikipedia page views during the last year and the trend increase in Stack Overflow.

Next page