Juan Convers

Energy Is Driving Euro Area Inflation


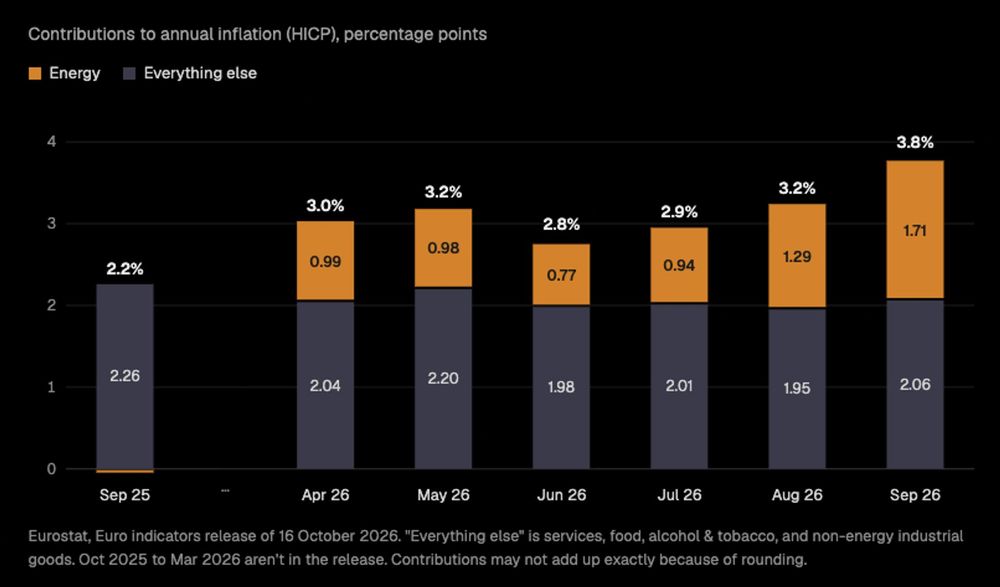
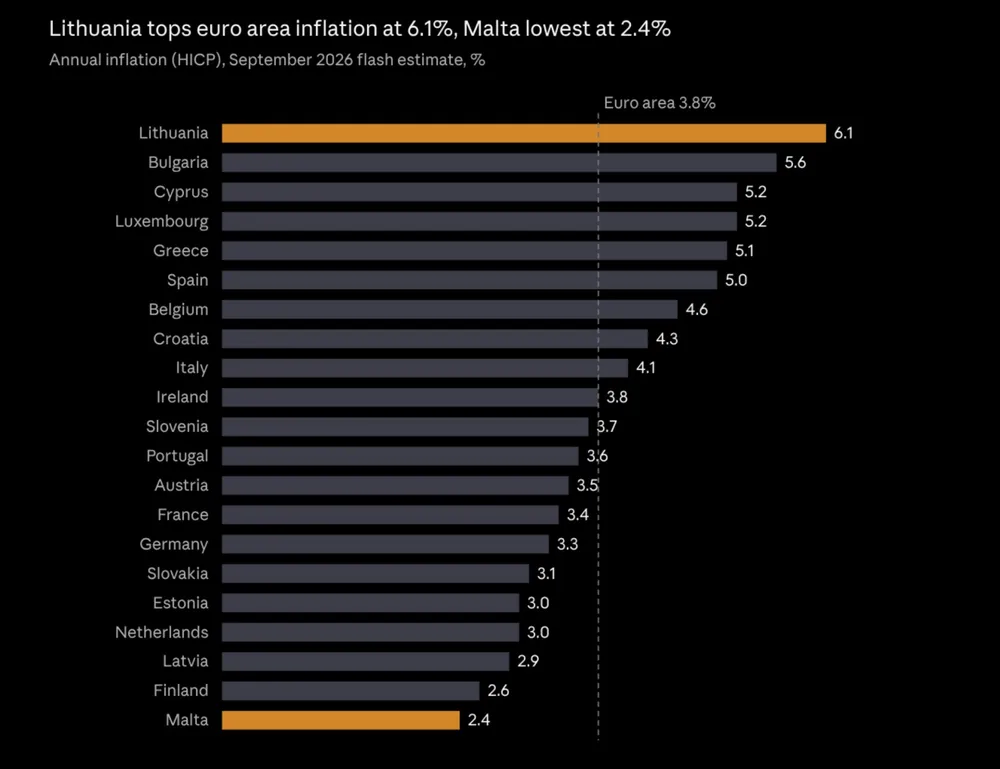
Every time I cross the border for groceries, I notice prices creeping up, so I was curious to see what the numbers say. According to the latest Eurostat release, annual inflation in the euro area rose to 3.8% in September 2026, up from 3.2% in August and 2.2% a year ago.

The chart above shows where that increase comes from. Energy is only about 9% of the basket, yet energy prices are up 18.9% year on year and now add 1.71 percentage points to the headline rate. That is almost half of all inflation. A year ago, energy was actually pulling inflation down slightly (-0.03 points).

Take energy out and the picture is much calmer. Inflation excluding energy is 2.3%, a bit lower than the 2.5% of September 2025. Services are still the largest steady contributor at 1.52 points, but they have barely moved in a year, and food has cooled from 3.0% to 1.3%.

So is this a real inflation problem or an energy shock? For now it looks like the second. The question is how long energy stays this expensive before it starts leaking into everything else :/. The next estimate probably will paint a clearer picture.

Note: Please find an interactive version of the chart above here.
Energy-driven Inflation in the euro area


Eurostat's flash estimate for September is out, and it is not the news anyone was hoping for. Annual inflation in the euro area is expected to reach 3.8%, up from 3.2% in August and well above the 2.2% we had a year ago.

That is almost double the European Central Bank’s 2% target. As is so often the case, the culprit is energy. Energy prices are up 18.8% compared with last September, and they rose 3.9% in a single month. For perspective, a year ago energy was actually getting cheaper (−0.4%).

The good news, if there is any, is that the rest of the basket looks fairly calm. Strip out energy, food, alcohol and tobacco, and core inflation sits at 2.5%, barely up from 2.4% in August. Services are at 3.2%, food at 1.4% and industrial goods at just 1.1%.

In other words, this looks like an energy shock rather than prices running away across the board. At least for now. Let’s hope there is some agreement on the Iran war, because, not surprisingly, rising oil prices are fueling this energy-driven inflation.

Oil Prices Are Trending Up


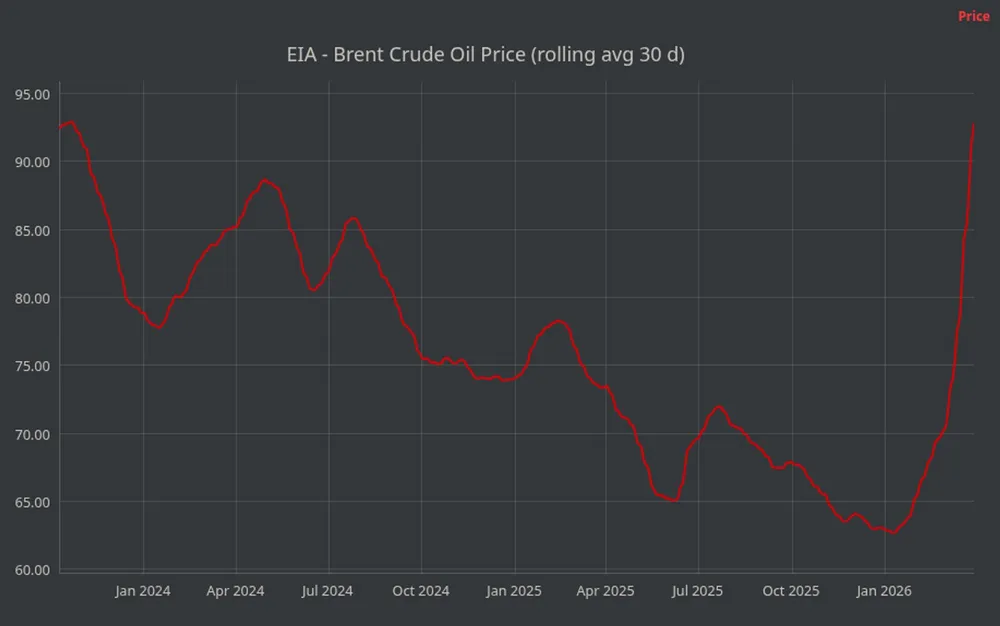
A 30-day rolling average of EIA oil price data shows a clear upward trend over the past three months, aligning with the escalation of the 2026 conflict involving the United States, Israel, and Iran. Disruptions around the Strait of Hormuz have tightened global supply and increased uncertainty in energy markets.

Iran’s use of asymmetric tactics—targeting shipping routes and regional infrastructure—has amplified these effects, adding a persistent risk premium to oil prices. Unfortunately, this trend could have broader consequences, increasing costs across the global economy and putting added pressure on food supply chains.

Inflation in the EU Zone


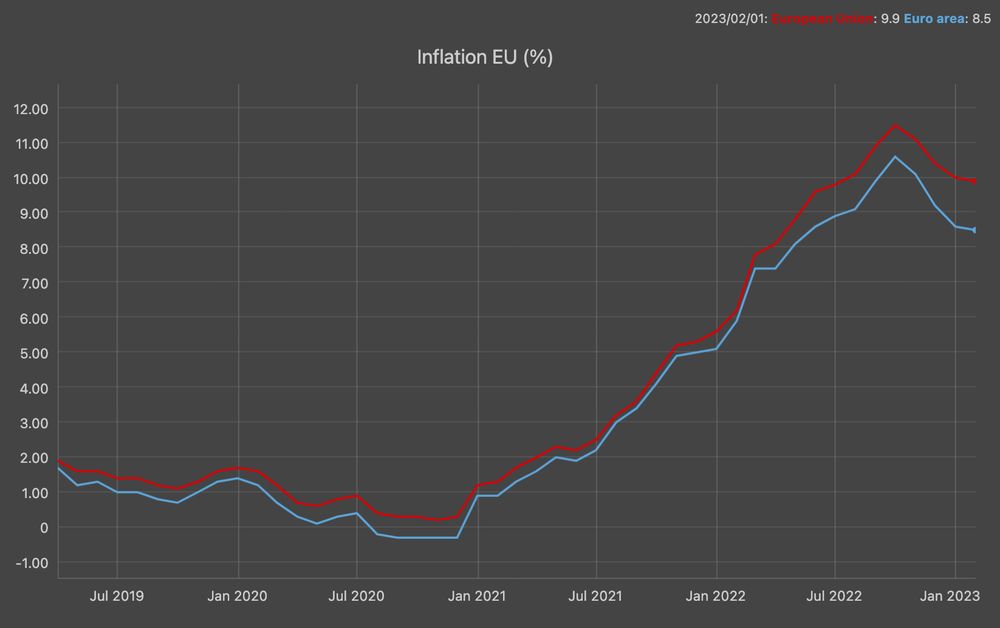
On the Eurostat website, inflation data for the Eurozone and the European Union reveals a decrease compared to the peak observed nearly one year ago. Nevertheless, as reported by Euronews, the European Commission has revised its economic projections downward, noting that persistently high prices for goods and services are having a more substantial adverse effect than originally foreseen.

For 2023 and 2024, inflation in the nations using the common currency is expected to be 5.6% and 2.9%, respectively. These figures are still well above the European Central Bank's (ECB) annual target of 2%, which it aims to reach through interest rate increases.

Inflation in Europe 2021 - 2023


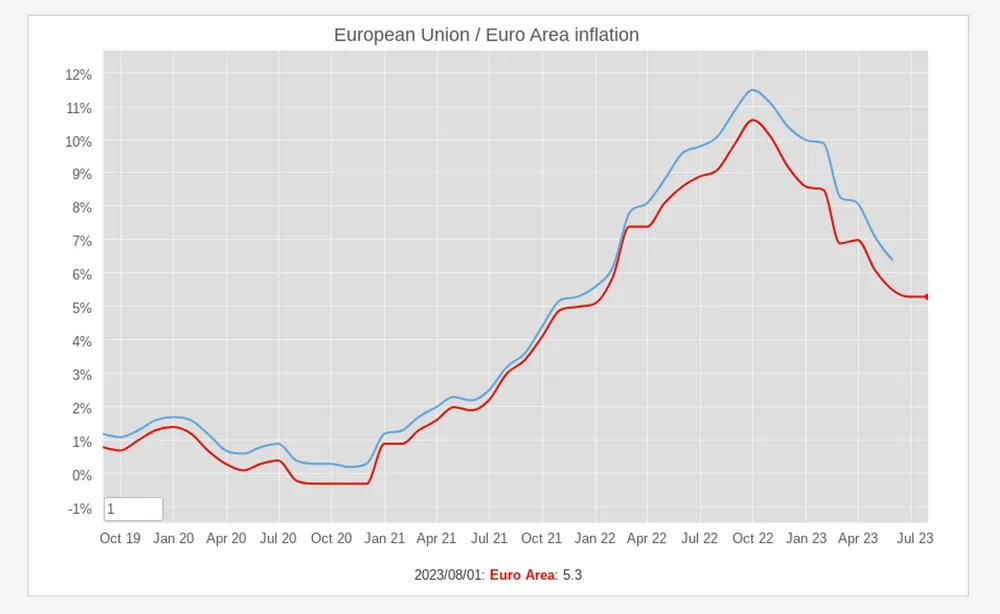
Inflation in Europe has been on the rise since the start of 2021, driven by a number of factors, including the COVID-19 pandemic, the war in Ukraine, and supply chain disruptions. In October 2022, inflation in the Eurozone reached an all-time high of 10.6%. It has since declined slightly, but it is still well above the European Central Bank's target of 2%.

The chart above, generated with data provided by Eurostat, shows this trend, including the October peak and the downward trend since then.

GDP and COVID-19 in Europe


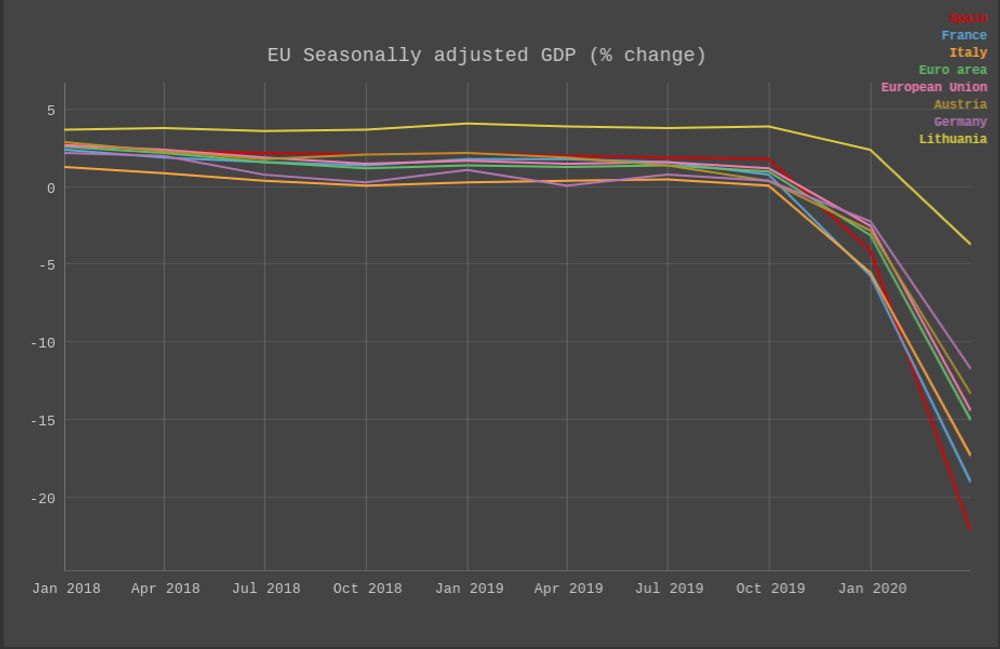
A couple of days ago Eurostat released a preliminary report on the GDP growth rate in the EU and the euro area. It's not surprising, but the COVID-19 situation and the required mitigation measures have taken a toll on the economy in Europe. The report discussed how "Seasonally adjusted GDP decreased by 12.1% in the euro area and by 11.9% in the EU, compared with the previous quarter". The graph above shows this dramatic trend.

Good Country Index


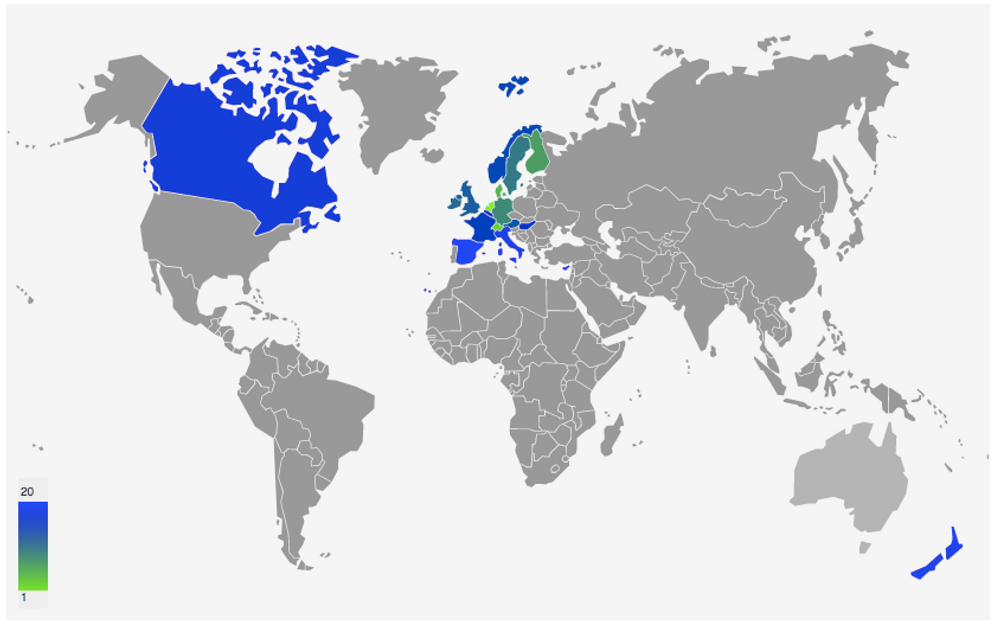
According to its website, the Good Country Index attempts to measure what each country on earth contributes to the common good of humanity, and what it takes away, relative to its size. The index takes into account several data points in different areas, such as Science & Technology, Culture, International Peace & Security, World Order, Planet & Climate, Prosperity & Equality, and Health & Wellbeing. The concept is quite interesting because we truly live on a single planet, so the policies adopted by any single country have effects on the rest of the world. The results for 2017 are:

1Netherlands
2Switzerland
3Denmark
4Finland
5Germany
6Sweden
7Ireland
8United Kingdom
9Austria
10Norway
11France
12Hungary
13Belgium
14Canada
15Singapore
16Italy
17New Zealand
18Spain
19Luxembourg
20Cyprus

Income Inequality


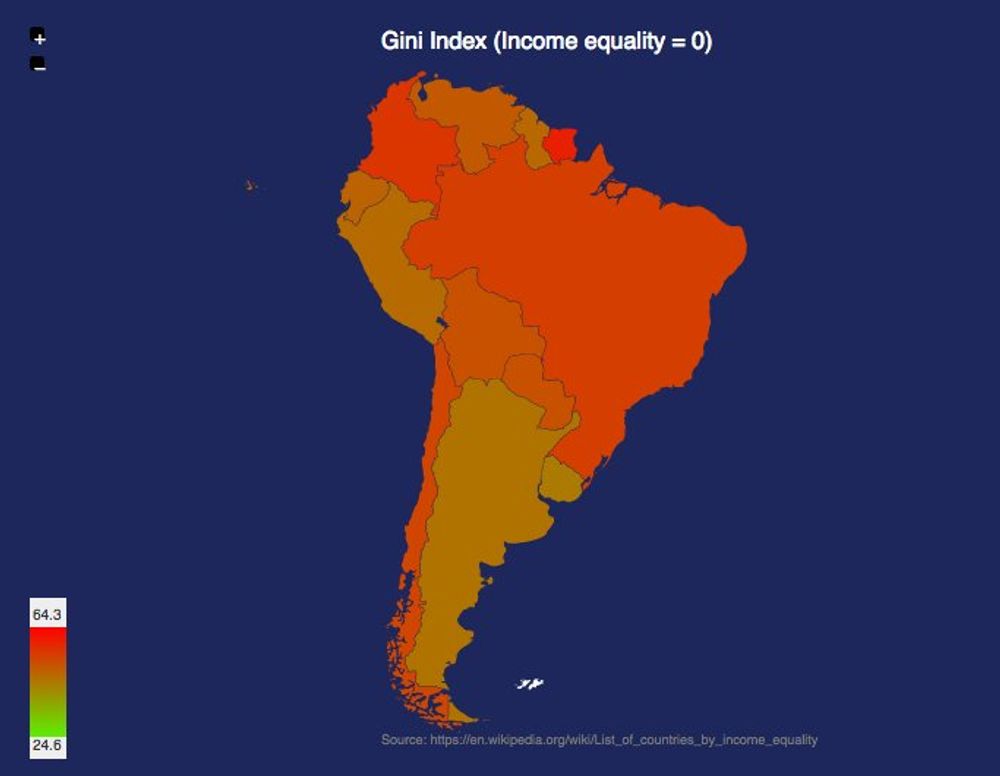
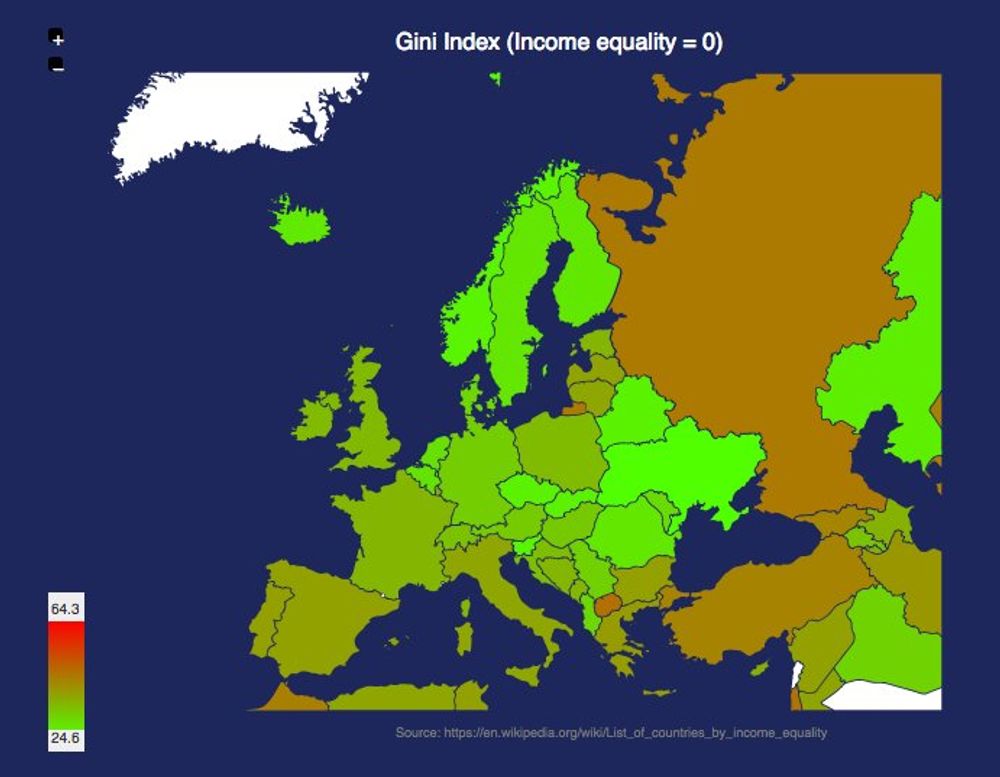
One of the many controversies of the incoming US presidential administration is the cabinet composed of very wealthy individuals. It's interesting to note that the US is not a very equal country compared to the other Western democracies. Even its northern neighbor is much more equal when comparing the Gini index.

It should be noted that this inequality is even worse in the south. The comparison between South America and Europe is striking:

Personal Money Transfers in the EU


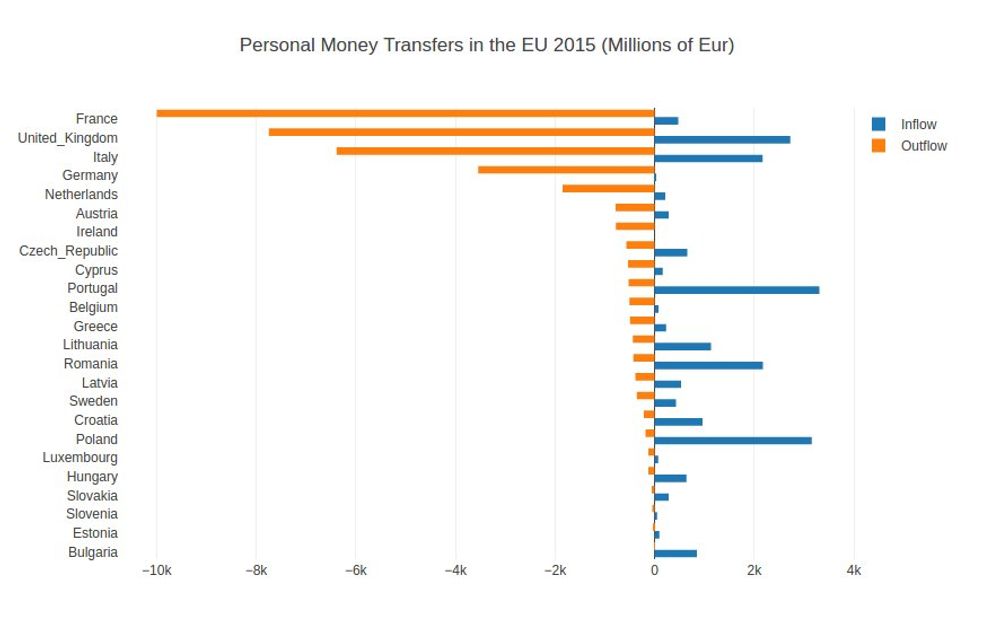
Interesting dataset from Eurostat regarding personal transfer inflows and outflows across the European Union. On one hand, France has the biggest negative balance, and on the other, Poland has the biggest positive one.

Big Mac Index


According to their website, "The Big Mac index was invented by The Economist in 1986 as a lighthearted guide to whether currencies are at their 'correct' level". It's interesting because even if it was designed to compare purchasing-power parity, it shows the imbalance between different currencies. This map shows the latest index, calculated in July 2016.

Alcohol inflation in Europe


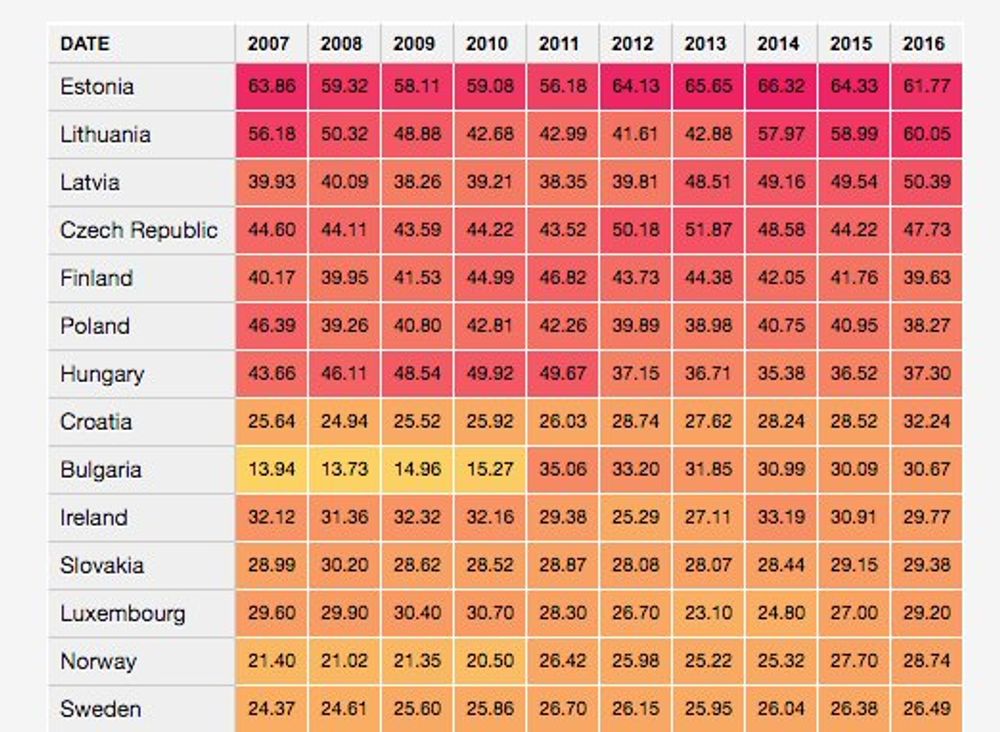
Inflation data from Eurostat. Alcohol is a big item in many of the "vodka belt" countries:

Newspaper job trends


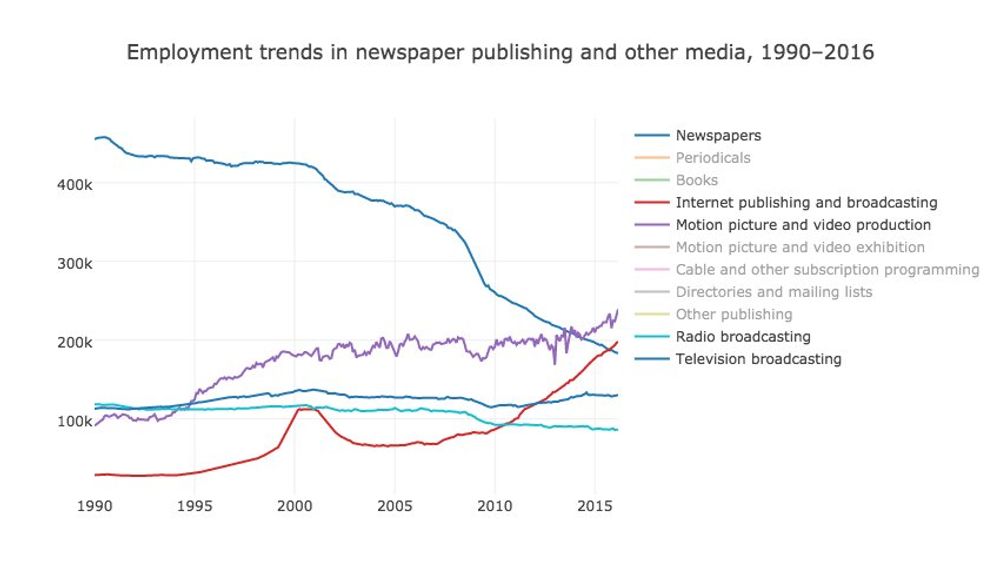
Some people shared an article today that uses data from a very interesting US Bureau of Labor Statistics dataset showing publishing job trends.

The data shows how information technology had a very important impact on traditional publishing jobs, particularly in the newspaper industry, during the last 25 years.

US Wealth Redistribution through taxes


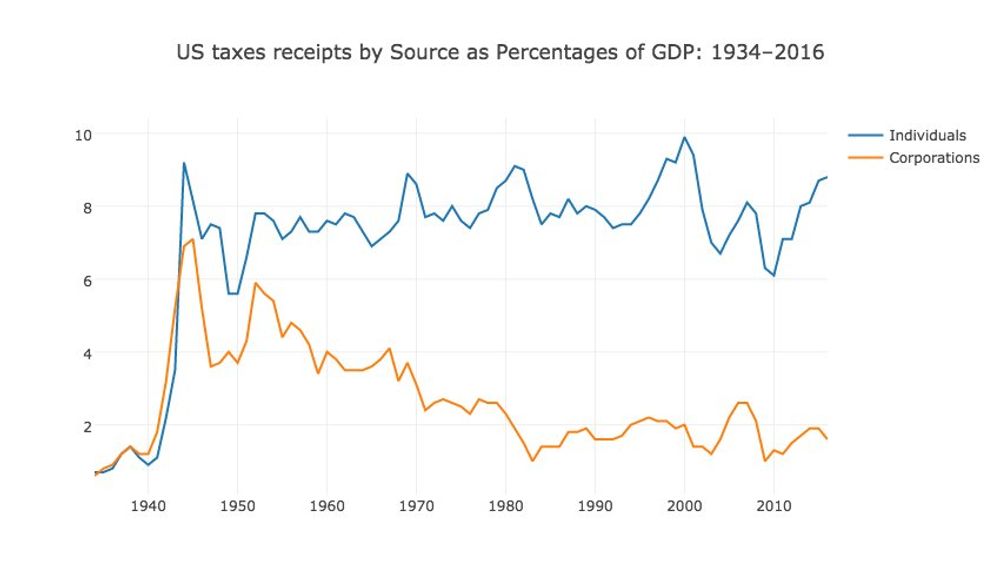
On his campaign website, in the Income Inequality section, Bernie Sanders describes how Wall Street and the billionaire class have rigged the rules to redistribute wealth and income to the wealthiest and most powerful people in this country.

The White House publishes different [data tables](https://www.whitehouse.gov/omb/budget/Historicals/) related to collected taxes, and one of them shows the share paid by individuals and corporations as a percentage of GDP over time.

Plotting this data as a time series shows that the Vermont senator clearly has a point.

Inflation in Venezuela


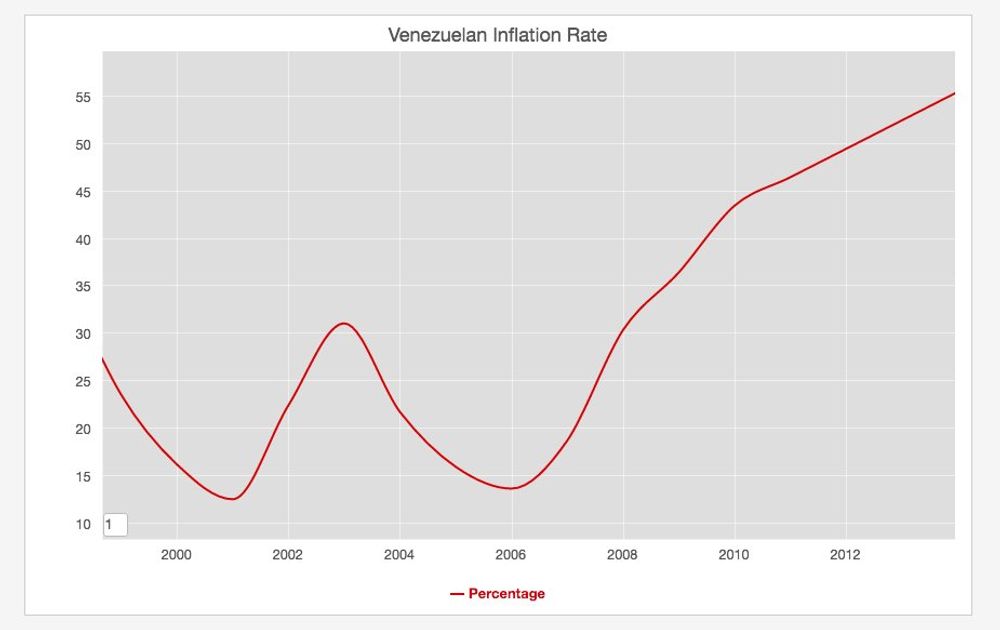
I was reading in the news today that the Venezuelan economy is in real trouble, with inflation going through the roof and a lot of shortages even of the most basic products. It's sad that the country with one of the biggest oil reserves in the world is in such bad shape. The IMF publishes data about inflation, and even if the newest data is from 2014, you can see the upward trend.

Berlin Salary Report


Yesterday, at Jobspotting, the company where I work, we published the very interesting Berlin Salary Report with data and analysis related to wages in the German capital. One of the most interesting charts of the report is the treemap above, which summarises the median salary based on years of experience and area of work.

As you can see in the graph, people working in Management and Software Development have the highest salaries on the scale, and this is related to years of experience. Interesting. #BerlinStartupSalaries

May 1st: Workers' Day


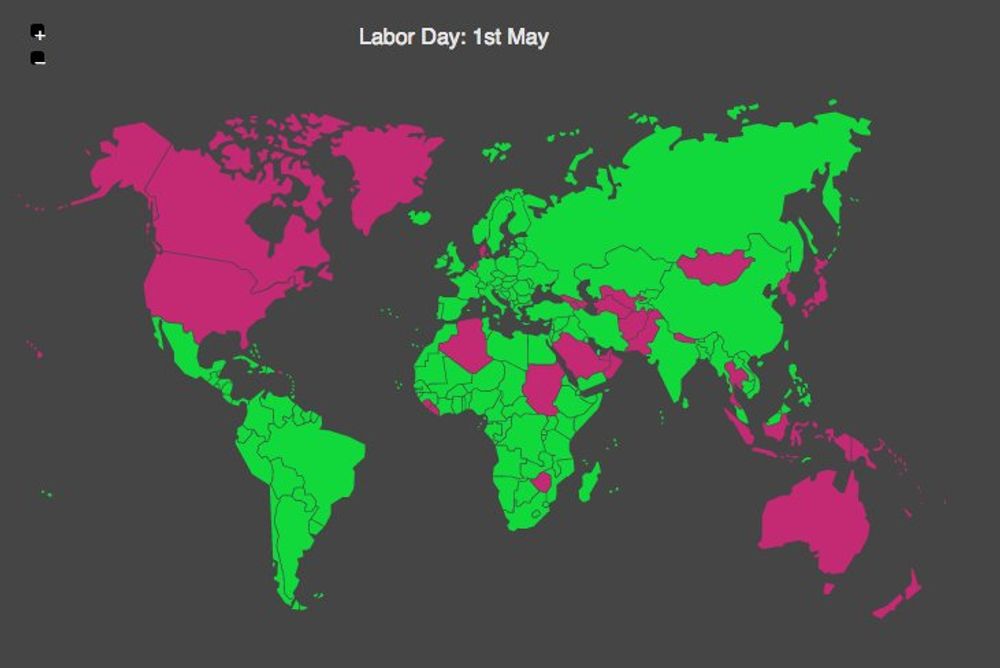
May 1st was chosen to be International Workers' Day in order to commemorate the events that happened on May 4, 1886, at Haymarket in Chicago. The police tried to disperse a public meeting during a general strike demanding an eight-hour workday, when an unidentified person threw a bomb at the police. The police responded by firing on the workers, killing four protesters.

This day is celebrated in many countries either today or tomorrow.

Minimum Wage Worldwide


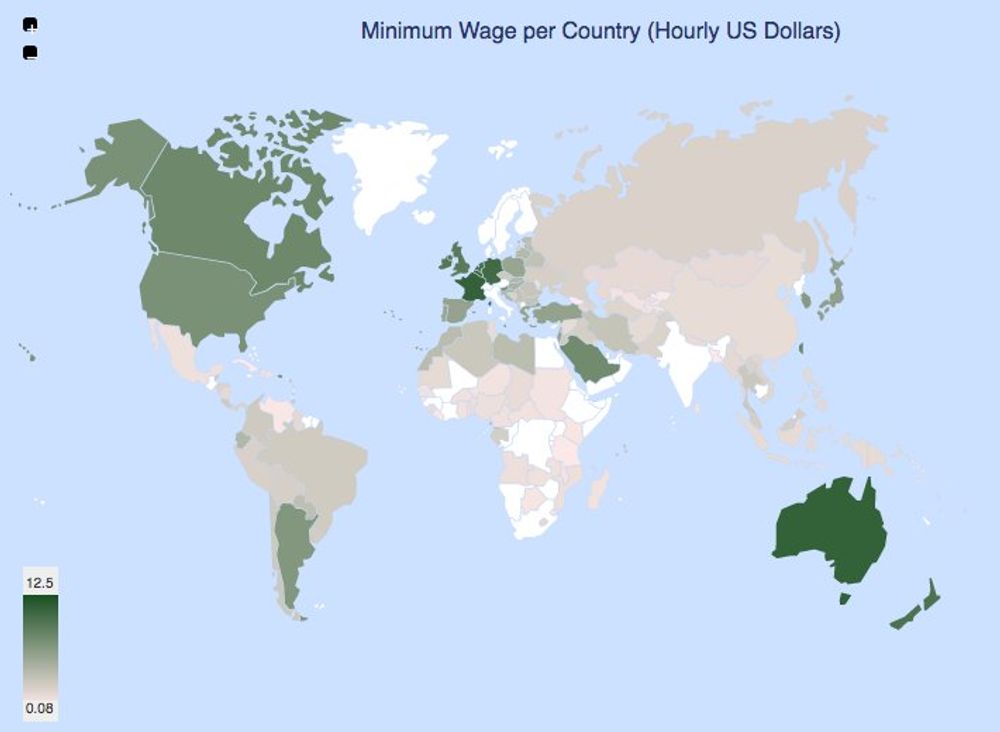
This morning I was reading news about the discussion in the US primaries related to the minimum wage in the US, particularly in NY and CA. Wikipedia contains an article tracking the minimum wage worldwide. The map above summarizes the data.

European Union GDP Treemap


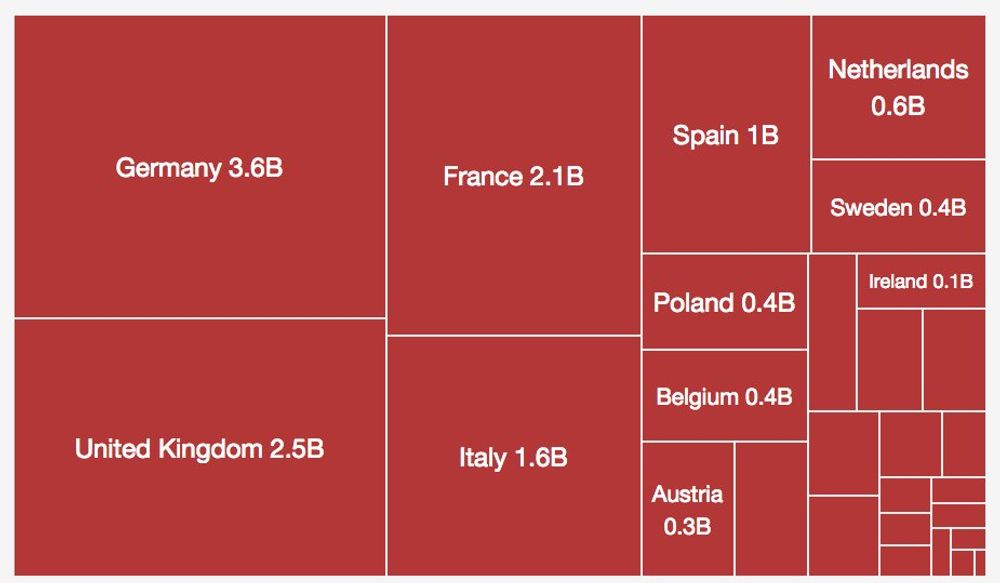
Playing with treemaps. Here is one with the GDP of the countries of the European Union. Germany and the United Kingdom are the biggest ones.

Inflation In Europe


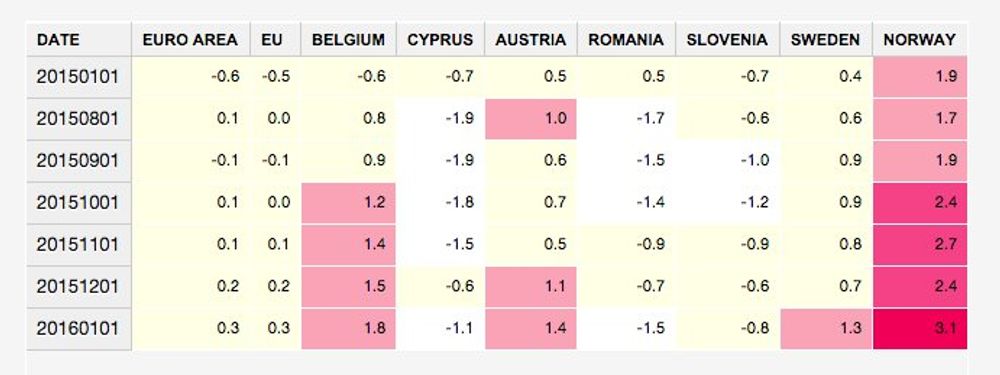
Last Thursday Eurostat published the inflation data for January 2016. Even if those numbers are definitely better than the hyperinflation happening in other regions of the world (cough ... Venezuela), there is always the risk of deflation:

Now it's remarkable how the highest rate in Europe was in Norway, a pretty expensive country already. I'm sorry for my Norwegian friends.

Podcast About When CEO Pay Exploded


Last night I was walking around the neighbourhood while listening to a very interesting podcast from NPR, explaining how and when CEOs’ compensation packages exploded. You can get it here. What they discussed in a nutshell was that companies tried to match their CEOs' compensation with performance (fair enough) using stock options, but the companies didn’t realize the exact value of those offers.

The Economic Policy Institute published an article last year about how CEOs make [300 times the salary of an average worker](http://jco.im/300-times).